Data Visualization: Bicycle Crashes Rise in Boston and Cambridge as Cyclists Call for Change

Image provided by Squarespace
By Alex Lott, Adri Pray, and Jack Kaplan
Editors Note (Dec. 9, 2025): A previous version of the article included an incorrect scatter plot representing the number of cyclist deaths per 100,000 people in several United States cities. That table and the text explaining the visualization has since been removed.
Minh-Thi Nguyen was a third-year graduate student studying experimental physics at the Massachusetts Institute of Technology. She lived in Kendall Square with a classmate, worked at the university in the physics department, and was considered a rising star in the scientific community.
Sidney Olsen loved being outside, and would wake up early on Sunday mornings to plan out breakfasts, art classes, ice skating trips, and outdoor expeditions. The Andover five-year-old was full of life, and loved “feeling the wind in her hair,” according to her father, Eric Olsen.
Six months ago, Nguyen was cycling to MIT’s campus when she was killed by a truck making a right turn at the intersection of Portland Street and Hampshire Street in Cambridge. In May 2023, Olsen was killed at a crosswalk minutes away from her house by a truck, despite having a prominent walk signal.
In the past five years, Boston and Cambridge logged 2,287 roadside accidents involving cyclists — Nguyen and Olsen among them. Family members and community advocates point to both cases as examples of thousands of preventable deaths had the state appropriately invested into safer bike lanes and sidewalk infrastructure, and implemented automated enforcement measures targeting reckless driving in pedestrian zones.
Publicly available data on bike crashes provided by the cities of Boston and Cambridge show that each location saw an uptick in bike crashes from 2019 to the present. There were fewer crashes in 2020 and 2021, mostly due to the pandemic, but there has been a rise since 2022. 2023 had the most incidents with 539, and there were 114 injuries and 45 hospitalizations in Cambridge alone.
Massachusetts Avenue, spanning both Boston and Cambridge, had the most reported accidents of the two cities and intersected with many of the streets where crashes occurred. Much of the separated bike infrastructure along Mass. Ave. was constructed after 2021 in response to community petitioning. Previously, painted, or no, infrastructure existed along the street.
“We need to bring awareness to vulnerable road users and make the road safe for us to ride,” said Jo-Anne Wyndham, who sustained a spinal cord injury after being struck by a car while cycling in West Roxbury in 2011. “After my crash, the police officer who was investigating my case actually told me bikes don't belong on the roads. I want to see a lot of people out on bikes and I want better awareness for motorists.”
From the steps of the Massachusetts State House, and addressing hundreds of people gathered to remember fallen pedestrians and cyclists on a sunny day in mid-November, Alexa Gomberg recalled leaving the apartment she shared with Nguyen 10 minutes before her accident — the last time she saw her roommate and childhood friend alive. She invited those that have lost someone in a roadside accident to collect a yellow carnation from a vase at her feet, and called on officials to support automated enforcement measures and additional regulations on large vehicles.
Wyndham, standing next to her husband Jeff Kaufman, was among those who grabbed a carnation. Currently living in Jamaica Plain, it was important to the couple to ride the 6.6 mile route that wove through the sites where three Cantabrigians — Nguyen, Kim Staley, and John Corcoran — were fatally struck this year.
“One of the things that still does not sit well with me is the fatality in Cambridge where the car clearly must have been going too fast, lost control, jumped the sidewalk, killed the cyclist, and he still hasn't been sighted,” Wyndham said, referencing the lack of charges brought against the driver who “lost control of their vehicle” and fatally struck Corcoran along Memorial Drive in Cambridge in September.
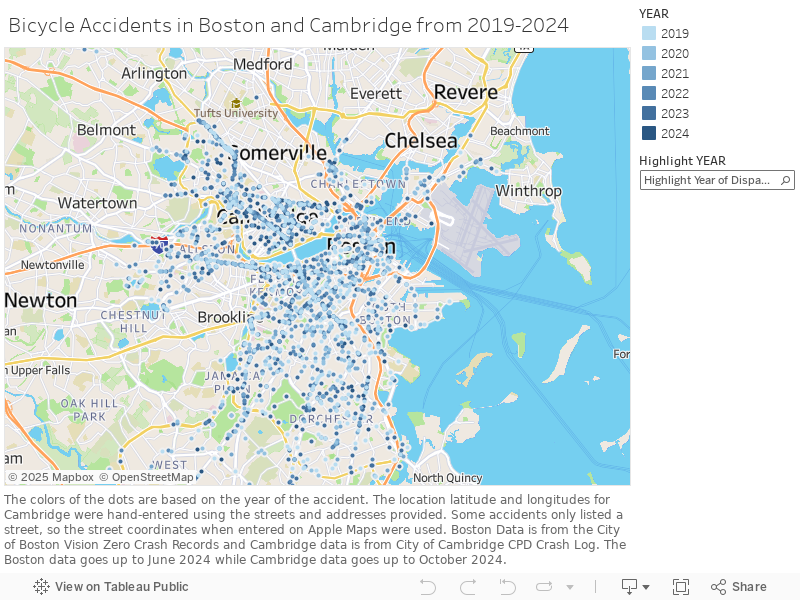
In the map above, each dot represents an accident that involved a cyclist in both Boston and Cambridge between 2019 and 2024. The data, provided by each city's police departments and dispatch systems, are only representative of the accidents reported to the police. The Boston data tracks accidents from June 30 and earlier, while the Cambridge data showcases data from to Oct. 31 and earlier.
Nguyen is one of three cyclists to have been hit at the intersection of Hampshire Street and Portland Street — the other two incidents took place in 2022. The intersection gives cyclists two options: no bike lane on Portland, or a painted, non-separated lane along Hampshire. Hampshire Street also stands out as one of three streets with the most cyclist fatalities in Cambridge in the past five years.
“Concerns [arise] when there's disruptions in the streets, so when the Red Line needs to be rerouted to shuttle buses like [between Harvard and Broadway in November], there's not enough coordination between the MBTA and the cities to make sure that the cycling lanes are still protected,” Gomberg, who organized the memorial ride in honor of her lifelong friend, Nguyen.
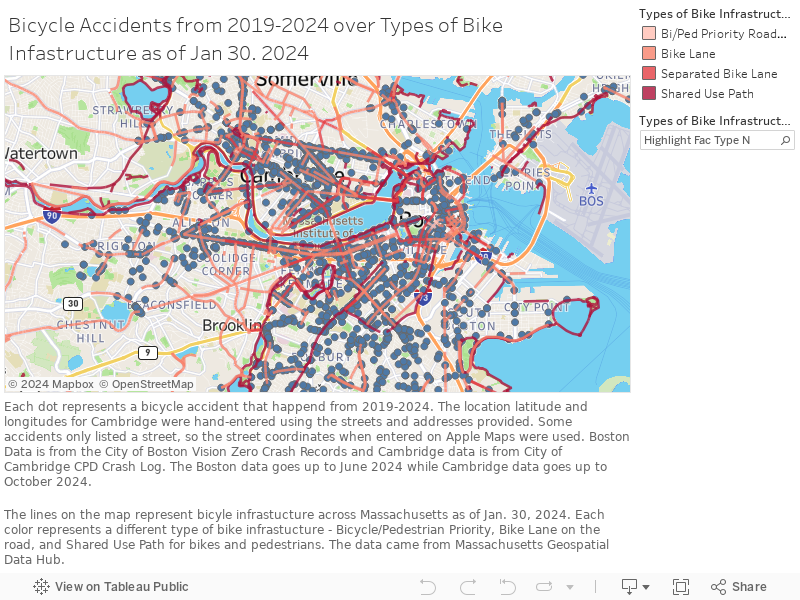
Many of the accidents happened where there is no bike infrastructure, meaning that cyclists and vehicles are sharing the same lanes. Most of the remaining accidents happened where there are bike lanes on the roads, but the lanes are not separated.
Boston and Cambridge are starting to construct separated bike lanes where there previously haven’t been a physical barrier between the car and bike lanes. Most of this construction started in 2021 according to the Better Bike Lanes project from Boston’s city government and the Cycling Safety Ordinance out of Cambridge. Both cities have plans to add more separated bike lanes in the next few years.
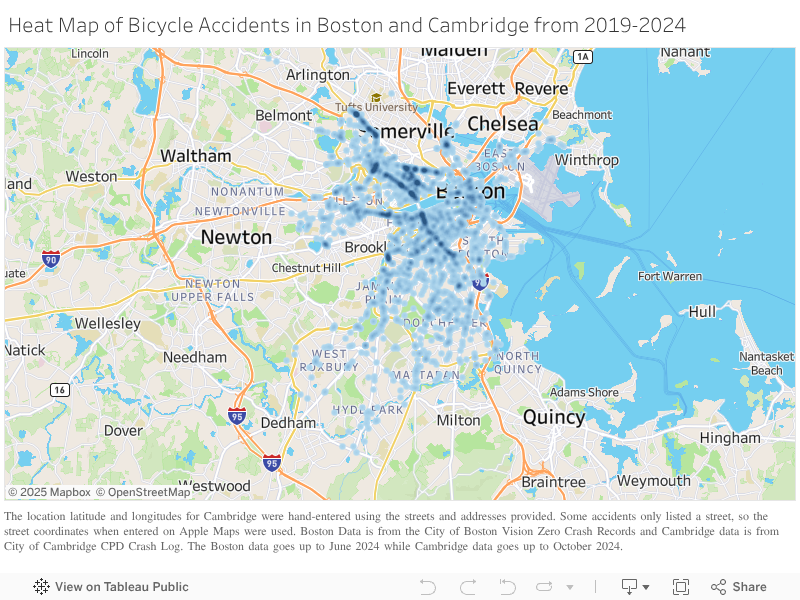
According to the density map, the streets with the most bicycle accidents in Cambridge are Massachusetts Avenue, Cambridge Street, and Hampshire Street. The most prevalent intersections are Massachusetts Avenue and Cambridge Street by the Harvard T station, Cambridge Street and Portland Street, Massachusetts Avenue and Albany Street, and Massachusetts Avenue and Vassar Street, with the latter two being by MIT.
In Boston, the streets with the most bicycle accidents are Route 20, especially by Boston University, Massachusetts Avenue, and Route 9. The most prevalent spots for crashes are the intersections of Beacon Street and Massachusetts Avenue, Massachusetts Avenue and Washington Street, Massachusetts Ave and Melnea Cass Boulevard by Boston University’s Medical Campus, Massachusetts Ave and Tremont Street by Northeastern, and South Huntington Avenue by the Back of the Hill T Stop.
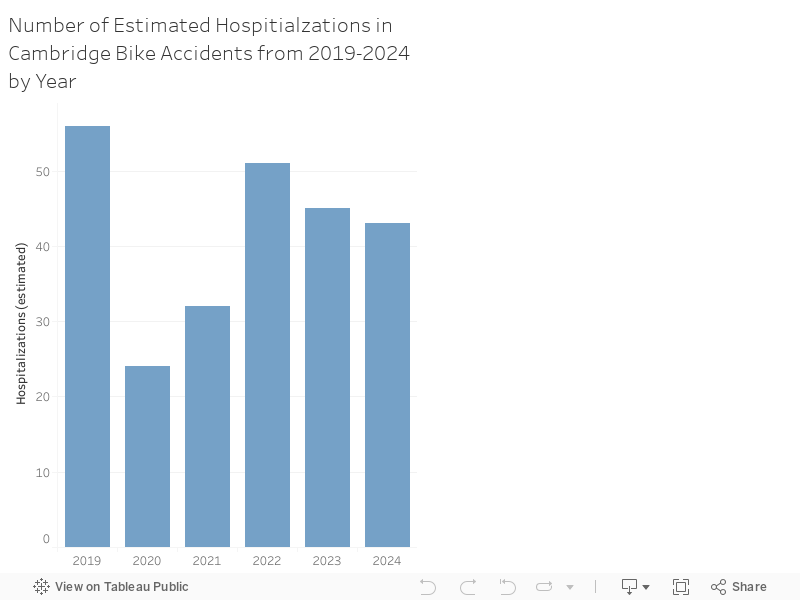
The graph below shows that there were 251 hospitalizations from bicycle accidents from 2019-2024 in Cambridge, with 2019 and 2022 having the most with 56 and 51 respectively. Boston does not record the severity of the crashes to protect the privacy of individuals according to the data description. Camrbidge only records up to hospitalizations, which is estimated.
This interactive map traces cycling fatalities across Boston and the subsequent policy changes they sparked. Though Boston ranks among America's safest cycling cities, each location marks a personal tragedy and a pivotal moment in the city's bike safety evolution. Through these interconnected stories, we examine three key elements: the lives lost at dangerous infrastructure points, the specific safety challenges that contributed to each incident, and the policy changes that followed - often reactively rather than preventively.
One bill, stuck in a legislative logjam, could give cycling advocates a win toward strengthening motor vehicle regulations. “An Act Relative to Automated Enforcement,” co-sponsored by Salem representative Manny Cruz and Watertown representative Steven Owens, would allow sensor devices along roadways to photograph vehicles committing camera-enforceable violations. Critics of the measure say it would strip the autonomy of motorists operating vehicles and has the potential to demoralize the police force in apprehending criminals.
“Right now it is a matter of debate whether or not this is the right approach to traffic zero,” Cruz said, addressing the crowd gathered in front of Beacon Hill. “We're coming up on a new legislative session and what we need now more than ever is to take our collective action and raise our support for this type of legislation.”
Ahead of the ride at the Cambridge Common, Freya Peers stood apart from the rest of the cyclist group. Peers, an international graduate student from Amsterdam researching cycling inequities, was surprised at the large turnout for the memorial ride because “back home, everybody just cycles.”
“A lot of my mobility is due to biking around in the Netherlands, and I've been terrified to cycle here. This is one of the first times I'm really cycling in the city,” she said. “I thought this would be a safe environment, but the infrastructure is terrible here.”
After living in Dedham for several months, Peers expects to go back to the Netherlands with a newfound respect for biking protections. Living abroad in Massachusetts has made her “enjoy the act of cycling” again.
View the methods of this story here.
Download the data set on Boston and Cambridge Accidents here.