Sports Commodification In Boston Part 3: At The Push Of A Button - How Streaming Services Affect Boston Sports Fans
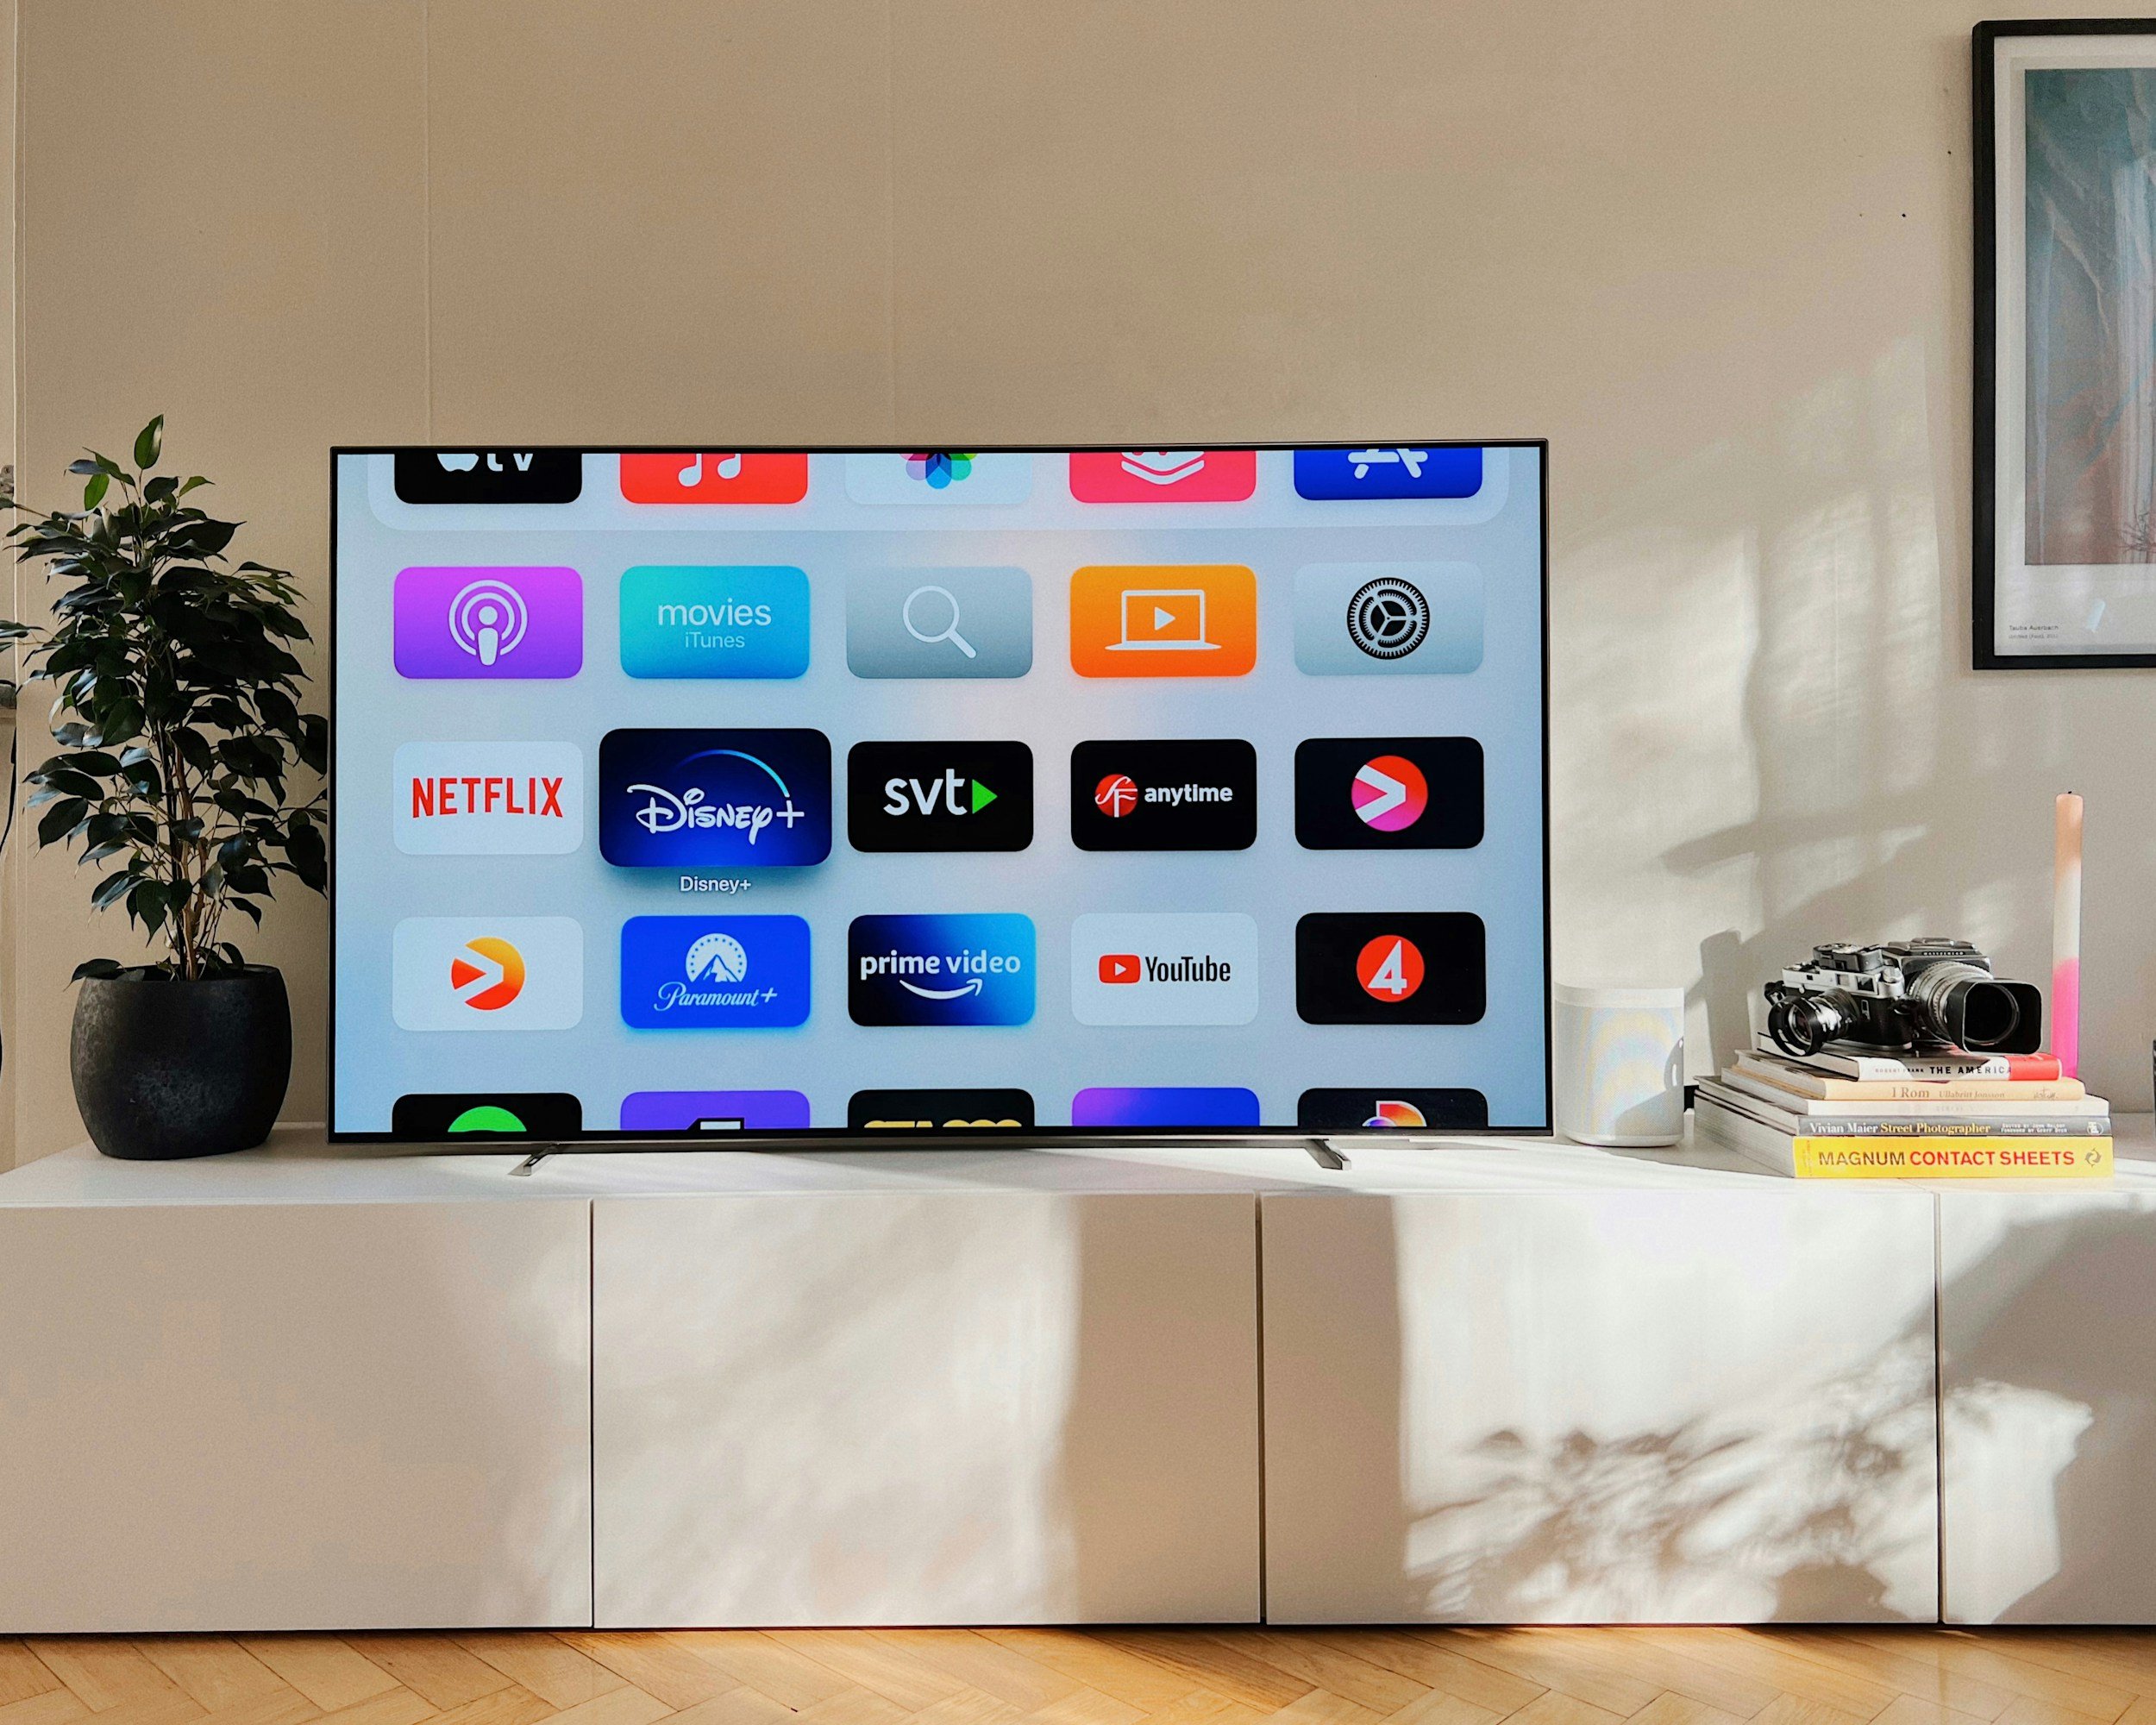
Streaming services have taken over the television industry, and now, live sports are following suit. Boston, home to one of the most passionate and dedicated sports fanbases, has felt this.
Sports Commodification In Boston Part 2: Priced Out From ‘Play Ball!’ - How Rising Ticket Costs Affect Boston Sports Fans
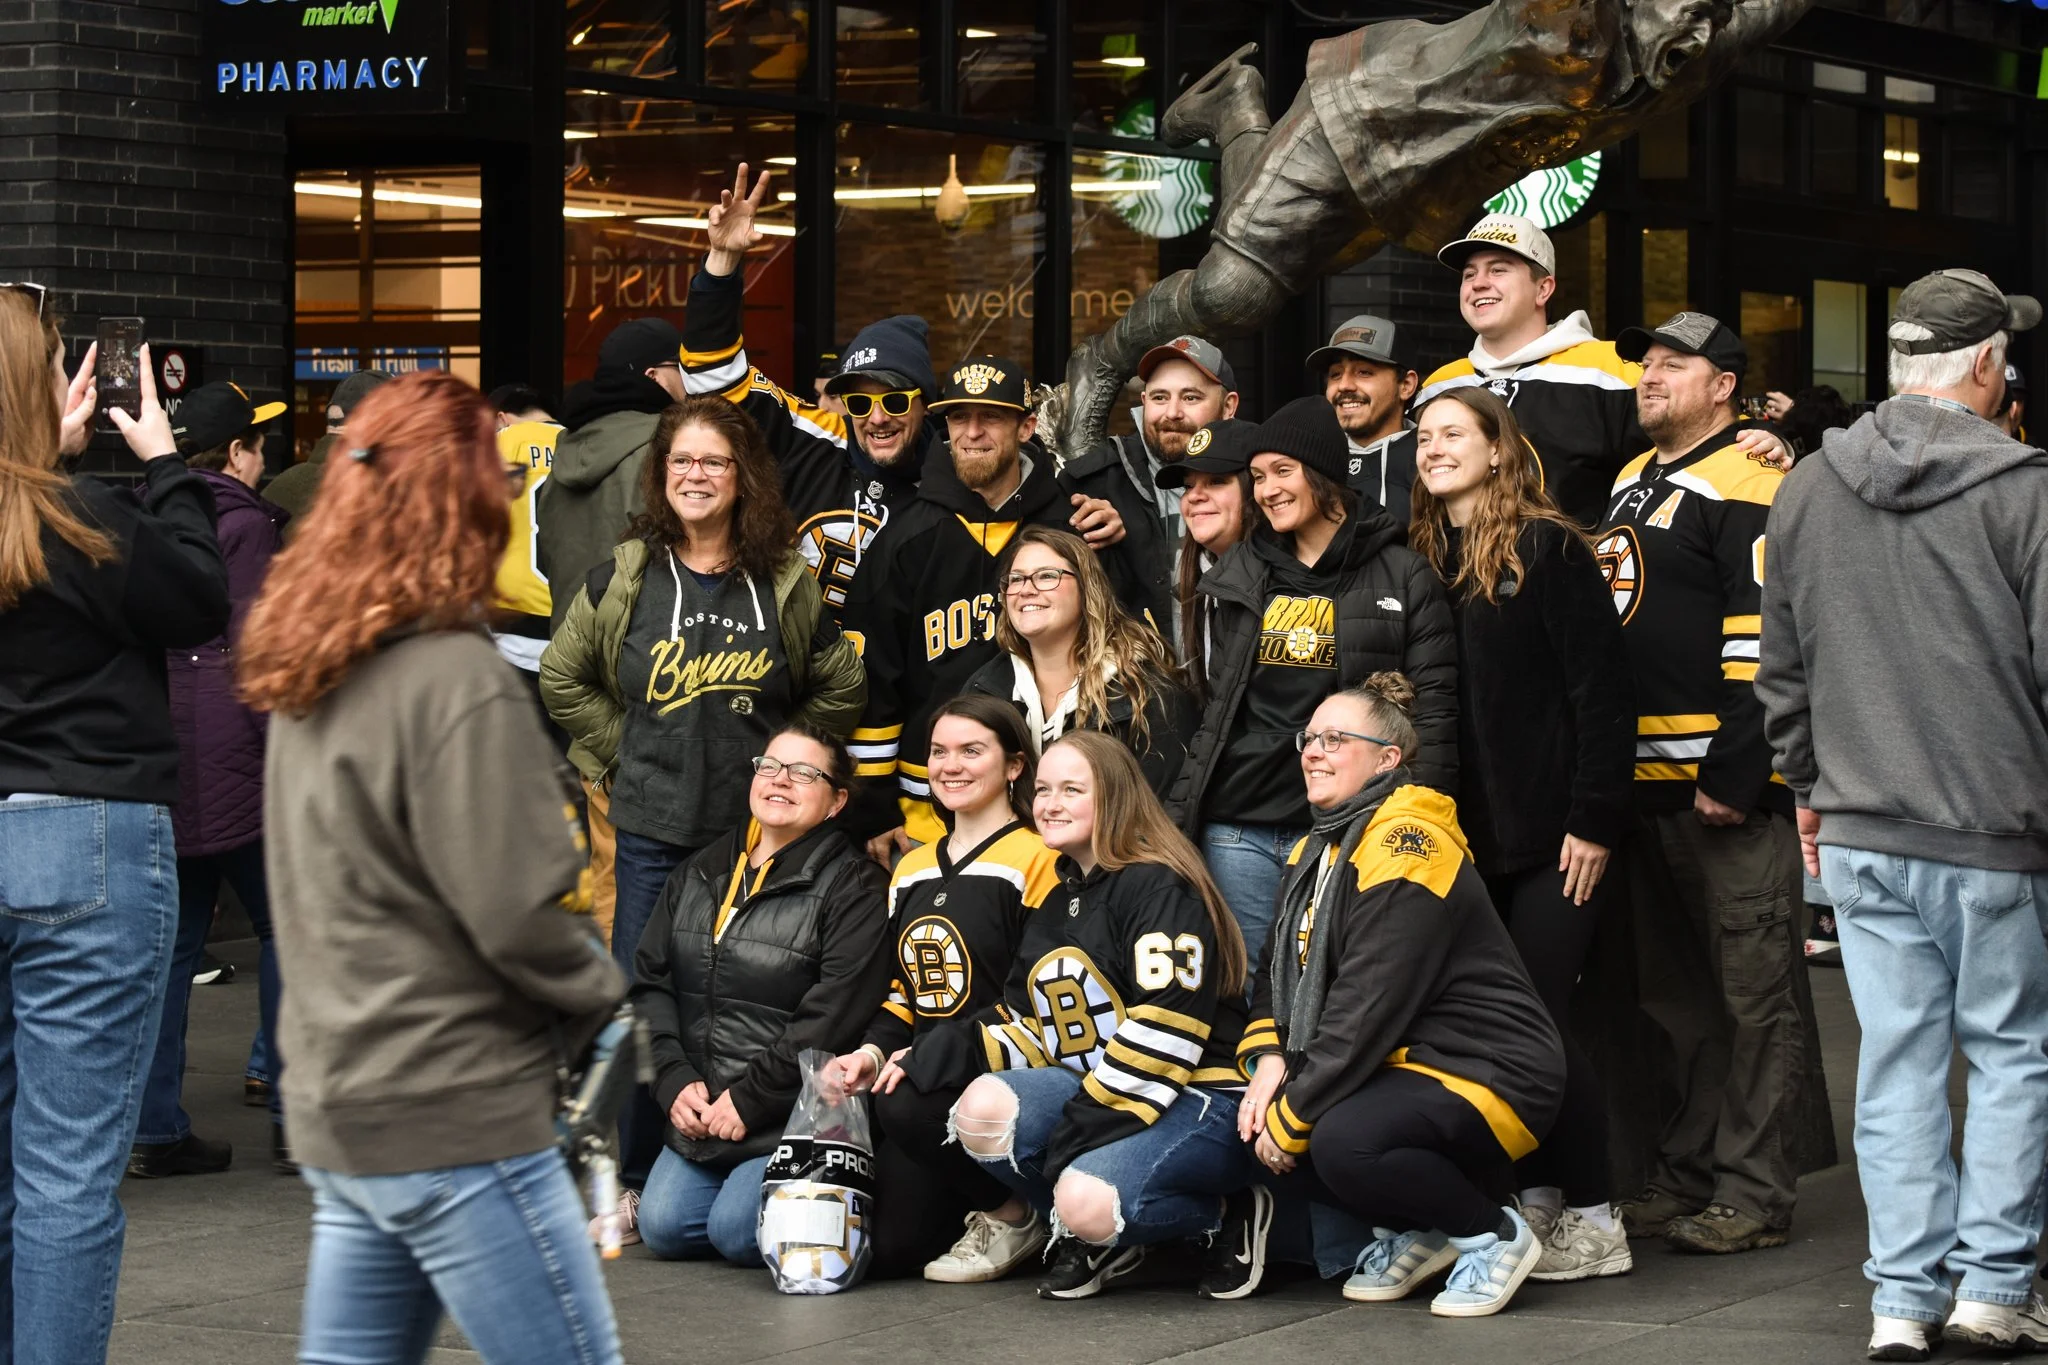
In a city with millions of diehard fans, Boston stands out as one of the fanbases not to piss off. Right now, they are certainly pissed off — about the rising costs of attending a game.
Sports Commodification In Boston Part 1: The Rise Of The Sports Commodity - From Billboards To ‘Brought To You By’
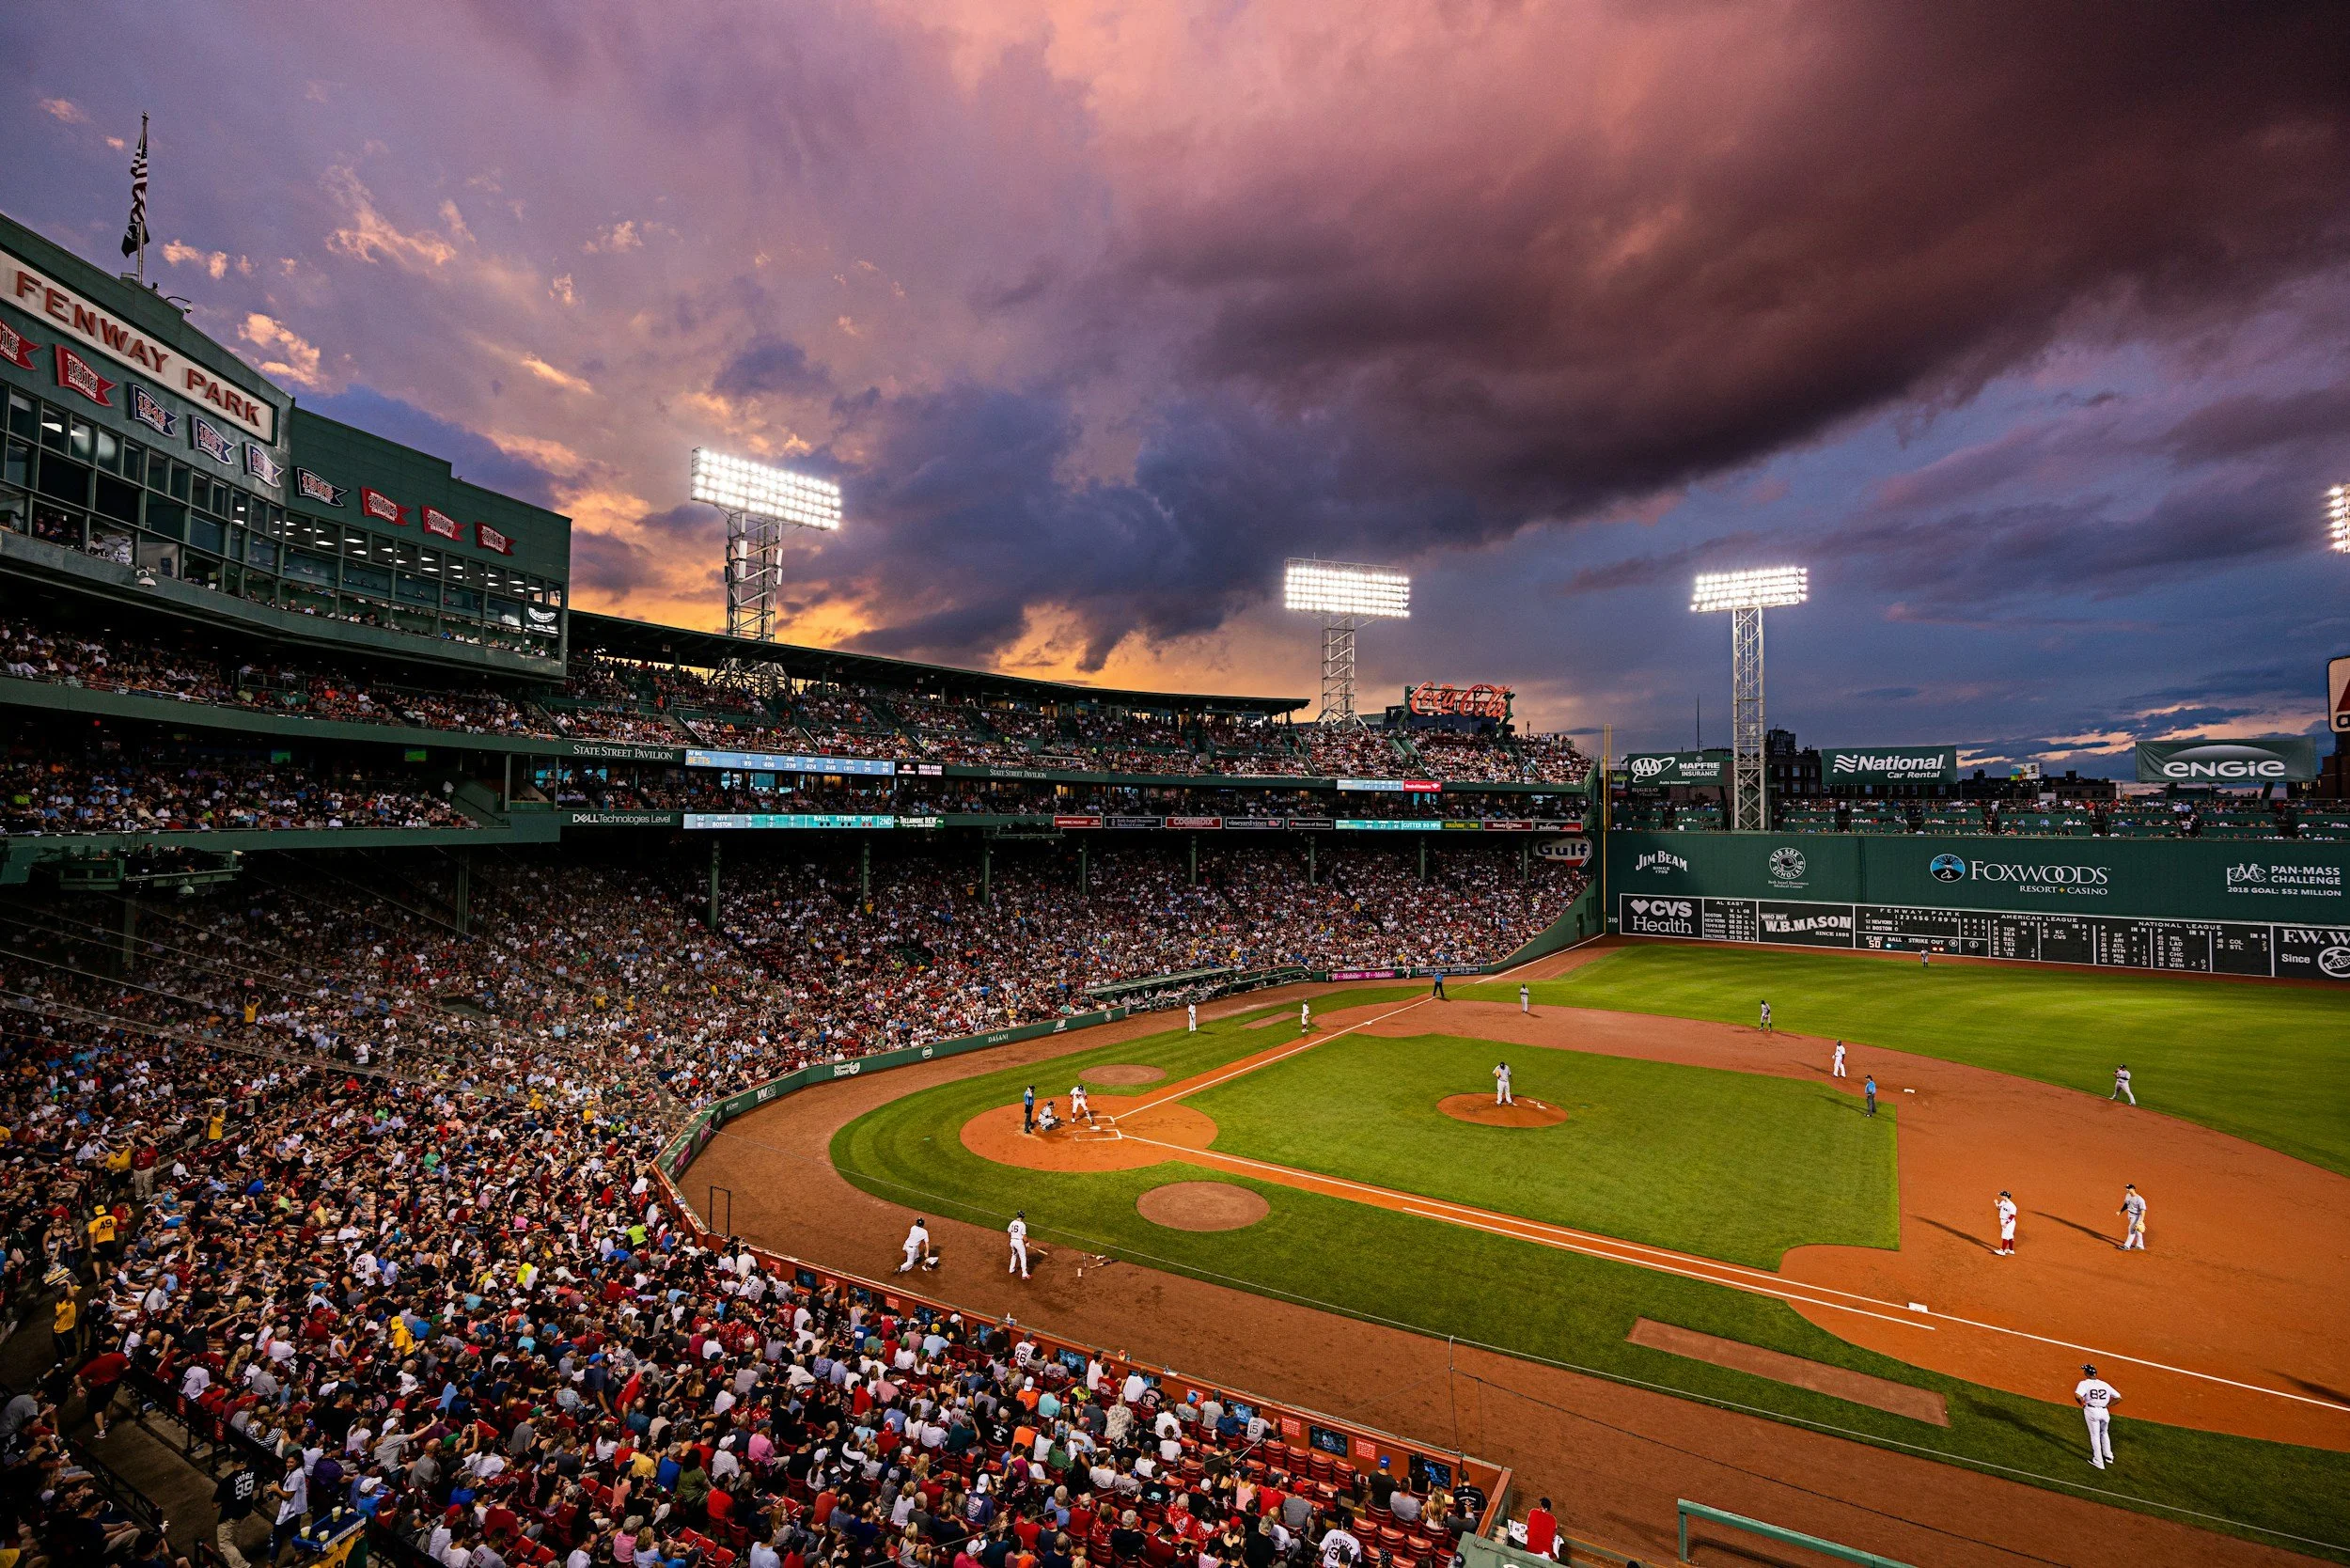
To go to a baseball game in 1975, you bought tickets at the venue, grabbed concessions, went to your seat, and watched the game. Today, fans buy tickets online, pay for parking, walk in, purchase overpriced concessions, get bombarded with in-stadium advertising, and watch the game. That’s if fans can afford to go to a game at all.